What If You Could Have East Hill Living—Without the East Hill Price Tag?
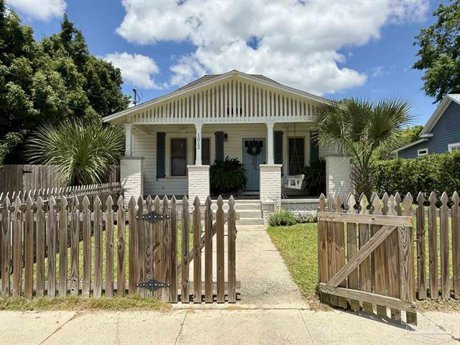
Everyone loves East Hill. Tree-lined streets, historic charm, Bayou Texar, downtown convenience...it's one of Pensacola's most sought-after neighborhoods.
But what if you could enjoy the same lifestyle just minutes away—and get substantially more home and land for your money?
That's exactly what this new listing delivers.
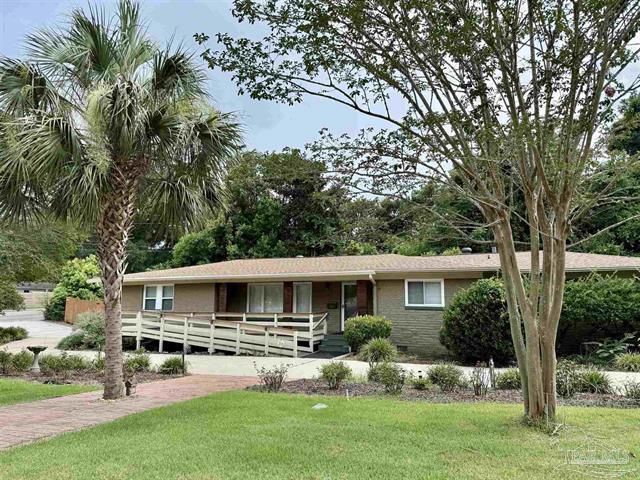
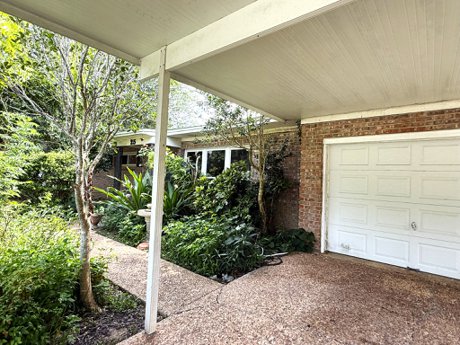
Situated just north of East Hill on an oversized 0.40-acre homesite, this beautifully maintained mid-century home offers something that's becoming increasingly difficult to find: space, flexibility, and character.
Inside, original oak hardwood floors, abundant natural light, and thoughtful updates create a home that's warm, inviting, and move-in ready. The remodeled kitchen, spacious living areas, and split-bedroom floor plan make everyday living comfortable while providing excellent privacy.
One of the home's biggest surprises is its separate in-law or guest suite. Whether you need space for extended family, a private home office, visiting guests, or you're looking for future income potential, this flexible space opens the door to possibilities that many homes simply can't offer.
Step outside and you'll find even more value. A screened porch, hot tub, professionally landscaped yard with irrigation, RV hookup, circular driveway, workshop with power and cooling, and room to add another garage make this property ideal for buyers who need space to spread out.
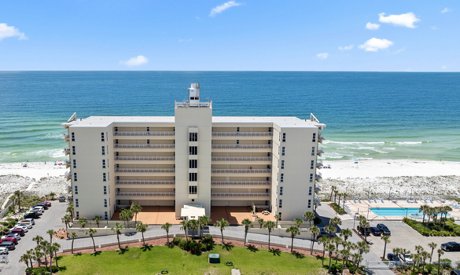
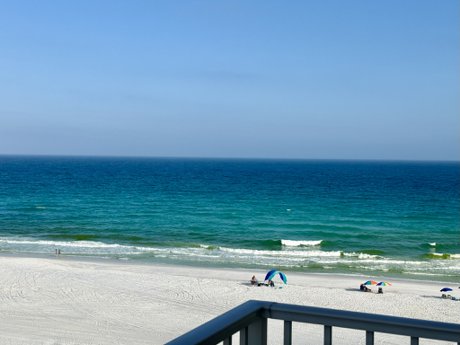
Location only adds to the appeal. You're just minutes from Bayou Texar, downtown Pensacola, shopping, hospitals, beaches, and everything that makes living in Pensacola so enjoyable.
In today's market, buyers are searching for homes that offer flexibility, usable space, and long-term value. Properties like this don't come along often—especially at a price point that's difficult to duplicate in nearby East Hill.
If you've been waiting for more house without sacrificing location, this may be the opportunity you've been looking for.


.jpg)