Pensacola Area Real Estate News & Market Trends

You’ll find our blog to be a wealth of information, covering everything from local market statistics and home values to community happenings. That’s because we care about the community and want to help you find your place in it. Please reach out if you have any questions at all. We’d love to talk with you!

Aug. 1, 2023

June Market Stats

The monthly June PAR stats are now available on Dropbox.

HIGHLIGHTS

  • June sales are up from last month and down from last year with 1004 units soldMay 935.Number of sales Y-O-Y, down 10.4%.
  • June average days on market is up slightly from May at 46 to: 47 Days.
  • Average sold price is $416,806, this is up from the prior month and up 0.8% since June 2022 Y-O-Y, $413,361.
  • June inventory is up to: 1891 unitsup from June 2022, with 1595 units. Y-O-Y increase in inventory of 19%
  • Months inventory is 1.9 months, up slightly from May at 1.8 months, but up from June 2022 with 1.4 months inventory. 
  • Average List to sold price difference in May was -1.6% a change from -2.1% in May.
  • The inventory of homes remains low. With 1.9 months inventory, is still a sellers marketin our area. When Months Inventory is less than 4.0 months it is considered a seller’s market.6.0 months or more is a buyer's market.

Posted in Market Updates
Aug. 1, 2023

Dog Days of Summer

Dog Days of Summer

These are the summer days on Pensacola Beach I wait for - the water is gin clear and warm. Sitting under an umbrella in the shade enjoying the sea breeze, watching perfect waves roll in and the birds fly by, looking for a fish I might want to cast a fly to; the setting is mesmerizing and it is why we live here. It is the place to be. Enjoy!

Posted in Greetings
June 30, 2023

Red, White, and Blues Week!

The week following Independence Day, Dubbed “Red, White, and Blues Week”, the Santa Rosa Island Authority hosts the Pensacola Beach Airshow Featuring the U.S. Navy Blue Angels.

RED, WHITE AND BLUES WEEK FEATURING THE PENSACOLA BEACH AIR SHOW – JULY 5-8, 2023

Kicking off the air show week is “Breakfast with the Blues,”
Wednesday, July 5, at 8:00 a.m. when the Blue Angels arrive and circle overhead to mark the show’s coordinates and center points along Pensacola Beach.

Thursday, July 6, at 2 p.m., the Blue Angels hold a full practice show over Pensacola Beach.

Friday, July 7, is the Pensacola Beach Air Show dress rehearsal, with the civilian acts beginning just after 11 a.m. and the Blue Angels overhead at 2 p.m.

Saturday, July 8, marks the official Pensacola Beach Air Show, and follows exactly Friday’s dress rehearsal schedule.


For more info visit: Blue Angels Air Show, Pensacola Beach | Visit Pensacola

Posted in Newsletter
June 8, 2023

Monthly Real Estate News

Click Here to Link to Chris’ Monthly Newsletter

Posted in Newsletter
March 13, 2023

February Pensacola real estate market stats are now available

The monthly February PAR stats are now available on Dropbox.

HIGHLIGHTS

  • February sales are up from last month but down from last year with 633 units sold. January 539. Number of sales Y-O-Y, down 29%.
  • February average days on market is up from January to: 59 Days.
  • Average sold price is $361,767, this is up from the prior month and up 3.7% since February 2022 Y-O-Y, $348,750.
  • February inventory is down to: 1783 units, up from February 2022, with 737 units. Y-O-Y increase in inventory of 132.5%
  • Months inventory is 2.8 months, down from January at 3.7 months, and up from February 2022 with 0.9 months inventory.
  • Average List to sold price difference in February was -2.8% a change from -3.8% in January.
  • The inventory of homes remains low. With 2.8 months inventory, is still a sellers market in our area. When Months Inventory is less than 4.0 months it is considered a seller’s market.6.0 months or more is a buyer's market.

Posted in Market Updates
Feb. 8, 2023

January 2023 Real Estate Stats for the Pensacola Area

The monthly January PAR stats are now available on Dropbox.

HIGHLIGHTS

  • January sales are down from last month and down from last year with 536 units sold. December 2022 there were 716. Number of sales Y-O-Y, down 32.4%.
  • January average days on market is up from December to: 51 Days.
  • Average sold price is $336,488, this is down from the prior month and Down 1.0% since December 2021 Y-O-Y, $339,839.
  • January inventory is down to: 1982 units, up from January 2022, with 809 units. Y-O-Y increase in inventory of 145%
  • Months inventory is 3.7 months, up from December at 2.8 months, and up from January 2022 with 1.0 months inventory.
  • Average List to sold price difference in December was -3.8% a change from -2.8% in December.
  • The inventory of homes remains low. With 3.8 months inventory, is still a sellers market but on the verge of a neutral market in our area. When Months Inventory is less than 4.0 months it is considered a seller’s market.6.0 months or more is a buyer's market.
Posted in Market Updates
Dec. 16, 2022

Real Estate Stats Pensacola Area

The monthly November PAR stats are now available on Dropbox.

HIGHLIGHTS

  • November sales are down from last month and from last year with 621 units sold. October 2022 there were 817. Number of sales Y-O-Y, down 30%.
  • November average days on market is up from October to: 34 Days.
  • Average sold price is $358,889 this is up from the prior month and Up 6.7% since November 2021 Y-O-Y, $336,348.
  • November inventory is up to: 2,086 units, up from November 2021, with 1,144 units. Y-O-Y increase in inventory of 82.3%
  • Months inventory is 3.4 months, up from October at 2.5 months, and up from November 2021 with 1.3 months inventory.
  • Average List to sold price difference in November was -3.5% an increase from -2.1% in October.
  • The inventory of homes remains low. With 3.4 months inventory, is still a sellers market but approaching a neutral market in our area. When Months Inventory is less than 4.0 months it is considered a seller’s market.
Posted in Market Updates
Oct. 19, 2022

September 2022 Greater Pensacola Area Real Estate Market Stats

The monthly September PAR stats are now available on Dropbox.

HIGHLIGHTS

  • September sales are down from last month and from last year with 898 units sold. August 2022 there were 960. Number of sales Y-O-Y, down 10.2%.
  • September average days on market is up from July to: 28 Days.
  • Average sold price is $380,558 this is up from the prior month and Up 14.4% since September 2021 Y-O-Y, $332,635.
  • September inventory is up to: 1,910 units, up from last September 2021, with 1,216 units. Y-O-Y increase in inventory of 57.1%
  • Months inventory is 2.1 months, up from July at 1.9 months, and up from September 2021 with 1.2 months inventory.
  • Average List to sold price difference is -1.7%
  • The inventory of homes remains low. With 2.1 months inventory is still a solid sellers market in our area.
Posted in Market Updates
Aug. 16, 2022

July 2022 Greater Pensacola Area Real Estate Market Stats

The monthly July PAR stats are now available.

HIGHLIGHTS

  • July sales are down from last month and down from last year with 925 units soldJune 2022 there were 1,118. Sales Y-O-Y, down 15.5%.
  • July average days on market is down from June to: 15 Days.
  • Average sold price is $387,099 this is down from the prior month but Up 15.4% since June 2021 Y-O-Y, with $335,510.
  • July inventory has increased to: 1,839 unitsUp from last month at 1,595 units and up from July 2021, 1,181 units. Y-O-Y increase in inventory of 55.7%
  • Months inventory is 2.0 months, Up from June at 1.7 months, and up from July 2021 with 1.7 months inventory. 
  • Average List to Sold price difference is -0.9%
  • The inventory of homes remains low.
Posted in Market Updates
Nov. 22, 2021

Property Sales Last Month

 
October 2021 Real Estate Sales
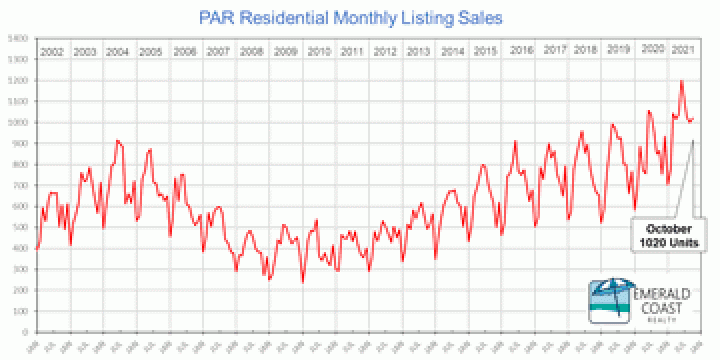
Sales in the Greater Pensacola and beach areas of condos and homes remain in record territory as seen in the monthly listing sales from the Pensacola MLS on the chart above. There were 1020 residential sales in October 2021. This is up from the previous month and year-over-year sales are significantly higher. This is the best October ever. Last year there were 866 sales in October. Inventory of homes and condos is very low, and the average residential price this month is at $338,980. The real estate market is continuing to be running hot, and sales are substantially greater than the past ten years sales. The current market is still considered a strong "seller's market"...
Posted in Market Updates